Observability: How Every Business Can Afford a Solid Setup
Observability helps you understand what's happening inside your systems. You can see the state of your applications, services, and network. This visibility enables you to detect and fix issues faster, essential for maintaining high performance and uptime.
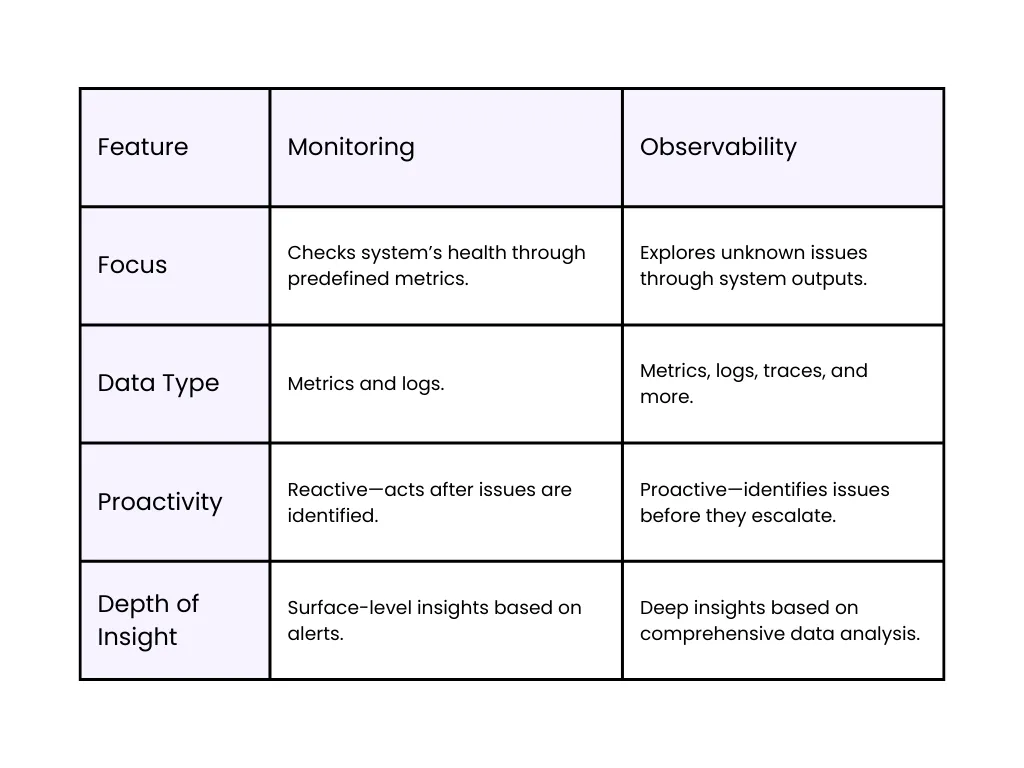
Why Is Observability More Than Just Monitoring?
Monitoring tells you if something is wrong, but observability helps you understand why it's wrong. Monitoring uses predefined metrics to alert you when things go wrong, but observability dives deeper and provides context. With observability, you can correlate different types of data to find the root cause of issues, making troubleshooting more efficient and effective.
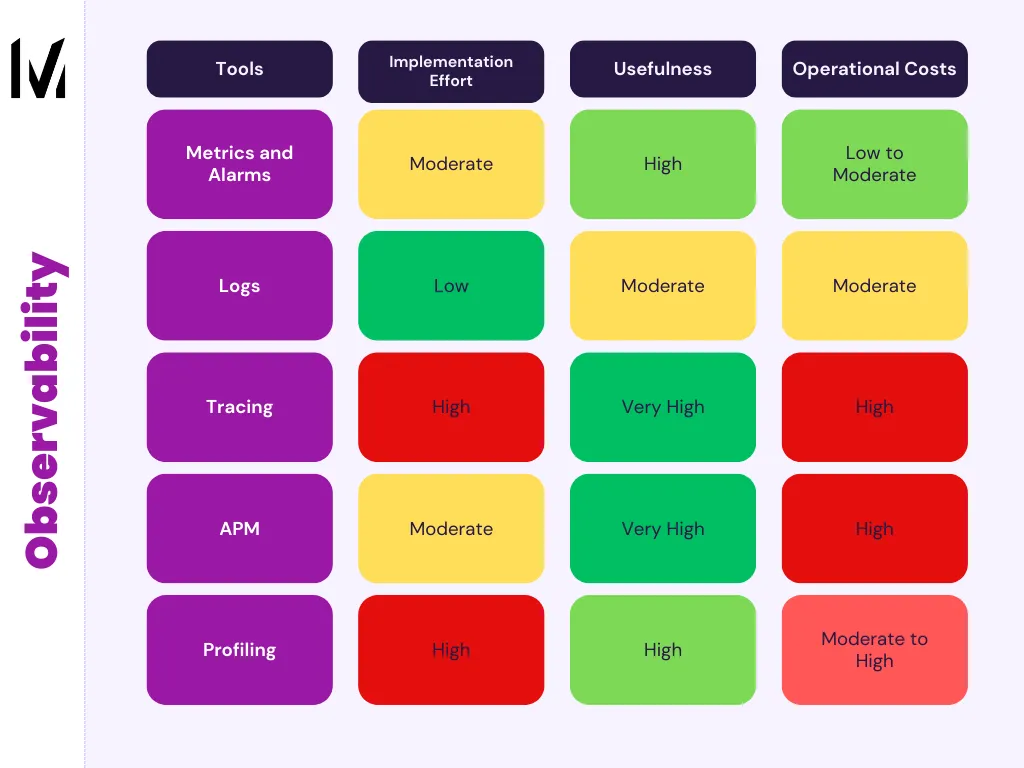
Metrics, Logs, Traces, APM
Observability consists of these key pillars:
The Most Popular Observability Platforms
How to Implement Observability
Observability: Cost vs. Benefit
Implementing observability might seem expensive. But it's an investment that pays off. With proper observability, you can maintain high SLAs. This translates to happier customers and fewer outages. Downtime is costly. Observability helps you avoid it.
At Das Meta, we believe in affordable, high-level observability. Our ready-made solutions provide comprehensive visibility into your systems. You don't have to break the bank to achieve top-tier observability.
We offer tools and expertise to help you implement observability effectively and affordably.
Stay Ahead in Cloud & InfraSubscribe to get concise, engineering-first insights on scaling infrastructure, cloud architecture, DevOps, and AWS funding opportunities—delivered monthly.No noise. Just practical knowledge.