Cloud Solutions
Application
Tracing
Troubleshooting x10 Faster
In the dynamic world of software development and troubleshooting, application tracing plays a vital role in diagnosing and optimizing the performance of software applications. It serves as a powerful technique to gain insights into the inner workings of an application, identify bottlenecks, and debug issues.
The Purpose, Benefits and Practical Implementation
Tracing implementation involves capturing and recording the execution of a program or system to analyze its behavior, performance, and interactions. Tracing is commonly used for debugging, profiling, and understanding the flow of execution in complex systems. The specific documentation for tracing implementation may vary depending on the programming language or framework being used.
The Benefits of Application Tracing
Tracing helps software teams understand how applications behave in real world. They easily find any issues and can improve the performance of applications. Here are some key benefits of application tracing:
-Identify Exact Issues and optimize efficiently
Monitoring tools usually provide overall information about system health, whereas tracing can provide a more detailed view of individual actions. Tracing can reveal not only that there is a problem but also precisely where it exists. This makes tracing highly effective and useful for distributed systems where issues can span multiple services or micro-services.
-Diagnose the root causes
Tracing links individual requests or transactions with specific code paths, user actions or service interactions. This contextual analysis helps to understand how different parts of an application affect each other and diagnose the root causes of an issue.
-Prioritize fixes based on user impact
Tracing often provides insights into how backend issues affect the user experience. Traditional monitoring tools do not always connect system metrics to user experience outcomes. With tracing development teams can prioritize bug fixes based on user impact.
The Practical Implementation - Materials & Requirements
You can enable tracing in EKS. You should deploy an ADOT collector which should be configured for tracing.
 receivers:
  otlp:
  protocols:
      grpc:
        endpoint: 0.0.0.0:4317
      http:
        endpoint: 0.0.0.0:4318
processors:
  filter/spans:
    spans:
      exclude:
        match_type: regexp
        attributes:
        - key: environment
          value: dev
  memory_limiter:
    limit_mib: 100
    check_interval: 5s
exporters:
  logging:
    loglevel: debug
  awsxray:
    region: "${region}"
service:
  pipelines:
    traces/to-aws-xray:
      receivers: [otlp]
      processors: ["memory_limiter","filter/spans"]
      exporters: ["awsxray","logging"]
Step-by-Step Instructions
Java:
1. Set up ADOT (Amazon Distributed Tracing) for tracing.
2. Navigate to the application repository.
3. Edit the Dockerfile and add a new line for tracing:
 RUN curl -vL https://github.com/aws-observability/aws-otel-java-instrumentation/releases/latest/
   download/aws-opentelemetry-agent.jar --output ./aws-opentelemetry-agent.jar
4. Build and deploy the new Docker image.
5. Add env variable on deployment
 OTEL_TRACES_SAMPLER: always_on
 JAVA_TOOL_OPTIONS: -javaagent:./aws-opentelemetry-agent.jar
 OTEL_RESOURCE_ATTRIBUTES: service.name=service-name
 OTEL_IMR_EXPORT_INTERVAL: 10000
 OTEL_TRACES_EXPORTER: otlp
 OTEL_JAVAAGENT_LOGGING: debug
 OTEL_JAVAAGENT_LOG_FILE: /var/log/otel-agent.log
 OTEL_EXPORTER_OTLP_ENDPOINT: http://adot-collector.adot.svc.cluster.local:4317
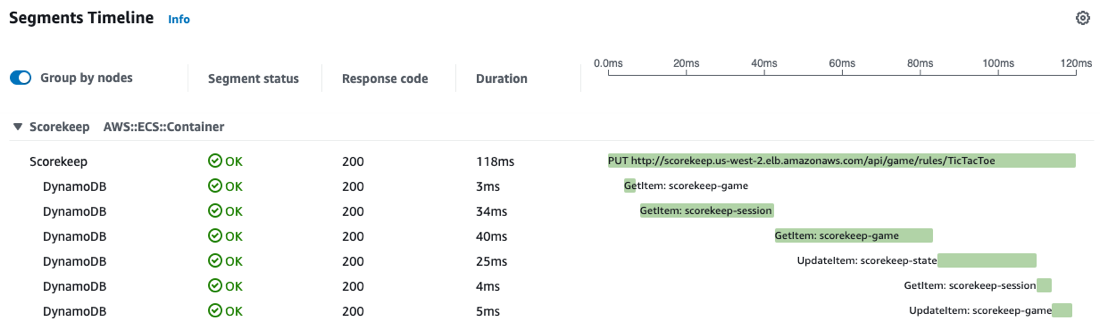
6. To verify the tracing setup, go to AWS CloudWatch, choose AWS X-Ray traces, and view the captured traces.
Javascript:
For Javascript backend applications the auto instrumentation works by loading the following simple tracing.js(.ts) file by using NODE_OPTIONS env variable.
How tracing auto-instrumentation file should be configured in node js container using env variable:
NODE_OPTIONS=--require /home/node/tracing/tracing.js
environment variables for configuration:
 TRACING_SERVICE_NAME=my-super-traceable-app
 TRACING_OTEL_RPC_ENDPOINT=http://adot-collector.adot:4317
 TRACING_ENABLED=false
 TRACING_ENABLE_DEBUGGING=true
tracing.js file:
 // tracing.js
// The function which init and auto instruments otel for node js
async function nodeSDKBuilder() {
  console.info("TRACING enabled", { "node --version": process.version });
  if (global.TRACING_INSTRUMENTATION_LOADED === true) {
      console.error("Tracing instrumentation already loaded so exiting");
      return;
  }
  global.TRACING_INSTRUMENTATION_LOADED = true;
  const opentelemetry = require("@opentelemetry/sdk-node");
  const { Resource } = require("@opentelemetry/resources");
  const { SemanticResourceAttributes } = require("@opentelemetry/semantic-conventions");
  const { BatchSpanProcessor } = require('@opentelemetry/sdk-trace-base');
  const { OTLPTraceExporter } = require('@opentelemetry/exporter-trace-otlp-grpc');
  const { AWSXRayPropagator } = require("@opentelemetry/propagator-aws-xray");
  const { AWSXRayIdGenerator } = require("@opentelemetry/id-generator-aws-xray");
  const { getNodeAutoInstrumentations } = require("@opentelemetry/auto-instrumentations-node");
  const _resource = Resource.default().merge(new Resource({
      // here we set the app/service name which will be shown in traces
      [SemanticResourceAttributes.SERVICE_NAME]: process.env.TRACING_SERVICE_NAME,
  }));
  console.info({
    "process.env.TRACING_OTEL_RPC_ENDPOINT": process.env.TRACING_OTEL_RPC_ENDPOINT,
    "process.env.TRACING_SERVICE_NAME": process.env.TRACING_SERVICE_NAME
  });
   // here we set otel service path to push generated traces into
  const _traceExporter = new OTLPTraceExporter({
    url: process.env.TRACING_OTEL_RPC_ENDPOINT
  });
  const _spanProcessor = new BatchSpanProcessor(_traceExporter);
  const _tracerConfig = {
      idGenerator: new AWSXRayIdGenerator(),
  }
  if (process.env.TRACING_ENABLE_DEBUGGING === "true") {
      console.info("Tracing logging enabled")
      // enable debug/logging of otel actions
      const { DiagConsoleLogger, DiagLogLevel, diag } = require('@opentelemetry/api');
      diag.setLogger(new DiagConsoleLogger(), DiagLogLevel.DEBUG);
  }
  const sdk = new opentelemetry.NodeSDK({
      textMapPropagator: new AWSXRayPropagator(),
      instrumentations: [
          getNodeAutoInstrumentations({
              // '@opentelemetry/instrumentation-amqplib': { enabled: false },
              // '@opentelemetry/instrumentation-aws-lambda': { enabled: false },
              '@opentelemetry/instrumentation-aws-sdk': { suppressInternalInstrumentation: true },
              // '@opentelemetry/instrumentation-bunyan': { enabled: false },
              // '@opentelemetry/instrumentation-cassandra-driver': { enabled: false },
              // '@opentelemetry/instrumentation-connect': { enabled: false },
              // '@opentelemetry/instrumentation-dataloader': { enabled: false },
              // '@opentelemetry/instrumentation-dns': { enabled: false },
              // '@opentelemetry/instrumentation-express': { enabled: false },
              // '@opentelemetry/instrumentation-fastify': { enabled: false },
              '@opentelemetry/instrumentation-fs': { enabled: false },
              // '@opentelemetry/instrumentation-generic-pool': { enabled: false },
              // '@opentelemetry/instrumentation-graphql': { enabled: false },
              // '@opentelemetry/instrumentation-grpc': { enabled: false },
              // '@opentelemetry/instrumentation-hapi': { enabled: false },
              '@opentelemetry/instrumentation-http': {
                  enabled: true,
                  ignoreIncomingPaths: [/\/health/, /\/pmapp-health/]
              },
              // '@opentelemetry/instrumentation-ioredis': { enabled: false },
              // '@opentelemetry/instrumentation-knex': { enabled: false },
              // '@opentelemetry/instrumentation-koa': { enabled: false },
              // '@opentelemetry/instrumentation-lru-memoizer': { enabled: false },
              // '@opentelemetry/instrumentation-memcached': { enabled: false },
              // '@opentelemetry/instrumentation-mongodb': { enabled: false },
              // '@opentelemetry/instrumentation-mongoose': { enabled: false },
              // '@opentelemetry/instrumentation-mysql2': { enabled: false },
              // '@opentelemetry/instrumentation-mysql': { enabled: false },
              // '@opentelemetry/instrumentation-nestjs-core': { enabled: false },
              // '@opentelemetry/instrumentation-net': { enabled: false },
              // '@opentelemetry/instrumentation-pg': { enabled: false },
              // '@opentelemetry/instrumentation-pino': { enabled: false },
              // '@opentelemetry/instrumentation-redis': { enabled: false },
              // '@opentelemetry/instrumentation-redis-4': { enabled: false },
              // '@opentelemetry/instrumentation-restify': { enabled: false },
              // '@opentelemetry/instrumentation-router': { enabled: false },
              // '@opentelemetry/instrumentation-socket.io': { enabled: false },
              // '@opentelemetry/instrumentation-tedious': { enabled: false },
              // '@opentelemetry/instrumentation-winston': { enabled: false },
          })
      ],
      resource: _resource,
      spanProcessor: _spanProcessor,
      traceExporter: _traceExporter,
  });
  sdk.configureTracerProvider(_tracerConfig, _spanProcessor);
  // this enables the API to record telemetry
  await sdk.start();
  // gracefully shut down the SDK on process exit
  process.on('SIGTERM', () => {
      sdk.shutdown()
          .then(() => console.info('Tracing and Metrics terminated'))
          .catch((error) => console.info('Error terminating tracing and metrics', error))
          .finally(() => process.exit(0));
  });
}
process.env.TRACING_ENABLED === "true" && nodeSDKBuilder(); // run otel auto instrumentation script/function
package.json with dependencies for tracing.js:
 {
  "name": "tracing",
  "version": "1.0.0",
  "description": "Tracing auto instrumentation for node.js apps, use NODE_OPTIONS=--require absolute-path-to-project/tracing/index.js env variable to enable tracing",
  "main": "index.js",
  "license": "MIT",
  "dependencies": {
    "@opentelemetry/api": "^1.4.1",
    "@opentelemetry/auto-instrumentations-node": "^0.36.6",
    "@opentelemetry/exporter-trace-otlp-grpc": "^0.38.0",
    "@opentelemetry/id-generator-aws-xray": "^1.1.1",
    "@opentelemetry/propagator-aws-xray": "^1.2.0",
    "@opentelemetry/resources": "^1.12.0",
    "@opentelemetry/sdk-node": "^0.38.0",
    "@opentelemetry/sdk-trace-base": "^1.12.0",
    "@opentelemetry/semantic-conventions": "^1.12.0"
  }
}
Tips and Troubleshooting
If you can’t see Traces on X-Ray you can check your ADOT collector data and which log it have. By examining the real-time ADOT log, you'll find information about receivers and exporters, providing insights into the issue at hand.
Conclusion
Compared to other monitoring methods, application tracing stands out for its ability to provide detailed, contextual information about how different components of an application interact with each other. This level of detail is invaluable for troubleshooting and optimizing applications, especially those built on modern, distributed architectures like microservices.
Open Source is a Philosophy
We understand that by collaborating with others in the community, we can create better technologies that have a positive impact on society.

Contact us
contracts@dasmeta.com
+49 30 16637857
Rheinsberger Str. 76/77 10115 Berlin Germany